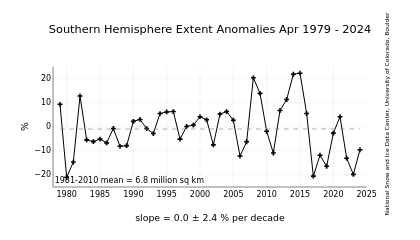
Hay otros gráficos:

con fuentes tan sonoras como las otras:
# Description: Global temperature. x-axis: year A.D. (1000–2004), y-axis: global temperature in °C. The black line is the smoothed global mean. The grey area is the smoothed 95% confidence interval of the estimates. The blue line is the regression line for the period 1000–1899. The red line is the regression line for the period 1900–2004.
The diagram illustrates several aspects of global warming. The rapid increase (as well as the earlier slow decrease) is statistically highly significant. One can also see that the 1990s most probably have been the last millenium's warmest decade.
Caution is required in interpretation, however, because the data prior to 1881 are estimates based on proxies (such as tree rings and ice cores). This makes both the accuracy and the temporal resolution of the estimates poorer than for the last century. Single years most certainly lay outside the confidence intervals. This does probably not affect the above conclusion about the 1990 decade, however.
# Source: graph drawn by Hanno using data from two sources. For the years 1000–1880, temperature estimates were taken from P.D. Jones & M.E. Mann (2004): "Climate over past millenia". Reviews of Geophysics, 42, article number RG2002. For the remainder, temperatures are based on instrumental records published on the web by P.D. Jones, D.E. Parker, T.J. Osborn & K.R. Briffa (2005) as "Global and hemispheric temperature anomalies – land and marine instrumental records". In Trends: A Compendium of Data on Global Change. Carbon Dioxide Information Analysis Center, Oak Ridge National Laboratory, U.S. Department of Energy, Oak Ridge, Tenn., U.S.A. [http://cdiac.esd.ornl.gov/trends/temp/jonescru/jones.html]
Esta es de relación entre concentración de CO2 y temperatura global:

También con una descripción muy
pro:
* Description: Atmospheric carbon dioxide concentration and mean global temperature during the past 1000 years. Carbon dioxide levels (blue line, left-hand axis) are given in parts per million (volume), temperatures (red line, right-hand axis) in degrees centigrade.
* Source: graph drawn by Hanno using data from different sources. For the temperature data, see Global temperature 1ka.png. CO2 levels are based on historical carbon dioxide records from ice cores drilled at the Law Dome in Antarctica, published on the web by D.M. Etheridge, L.P. Steele, R.L. Langenfelds & R.J. Francey (1998) as "HistKKKUUUKKKorical CO2 records from the Law Dome DE08, DE08-2, and DSS ice cores". In Trends: A Compendium of Data on Global Change. Carbon Dioxide Information Analysis Center, Oak Ridge National Laboratory, U.S. Department of Energy, Oak Ridge, Tenn., U.S.A. [http://cdiac.esd.ornl.gov/trends/co2/lawdome.html]
* Licence: released per the GNU Free Documentation License by the originator
Y tengo alguna más, pero no quiero aburriros.
La conclusión es que esto se está convirtiendo en una cuestión de fé, ... precisamente cuando los que viven de ella nos hablan de la crisis de la fé.
Como lo de la fé nunca me ha gustado me cuesta afiliarme a ninguna de las dos iglesias, aunque tengo más simpatÃa por la del calentamiento global, del mismo modo que, aun siendo ateo, me caen mejor los cuáqueros que los opusdeistas.
L
De lo que sà estoy convencido es de que, aun cuando no tenga nada que ver con el calentamiento global, reducir las emisiones de anhÃdrido carbónico y en general el consumo de energÃa, es bueno para todos.
(Bueno, excepto para la OPEP, Cheney, Bush Sr., Bush Jr., y demás peña petrolera, ...)